

When investment strategies or fund managers fail to deliver the returns clients expect, clients begin to doubt whether they’re using the right strategies, the right fund managers, and, often, the right financial advisors. Doubt is the enemy of investor success, and when constructing portfolios, investor behavior is a risk factor that should not be overlooked. When investors fail to “stay the course,” doubt is often the culprit.
While uncertainty about future returns is unavoidable, using what I call the Return Participation Ratio (RPR) can help deflate the doubt that clients experience. The RPR is a proactive behavioral coaching tool that aids advisors in setting realistic expectations for future returns. This focus on outcomes is critical. Unlike return forecasts, the RPR doesn’t attempt to predict the direction or magnitude of future returns. Instead, it indicates the likelihood that a fund will participate in its benchmark’s returns, helping set appropriate client expectations.
To illustrate, I’ve borrowed and adapted a chart from Howard Marks at Oaktree, modifying the axis labels to highlight the importance of outcomes (Figure 1).
Figure 1.
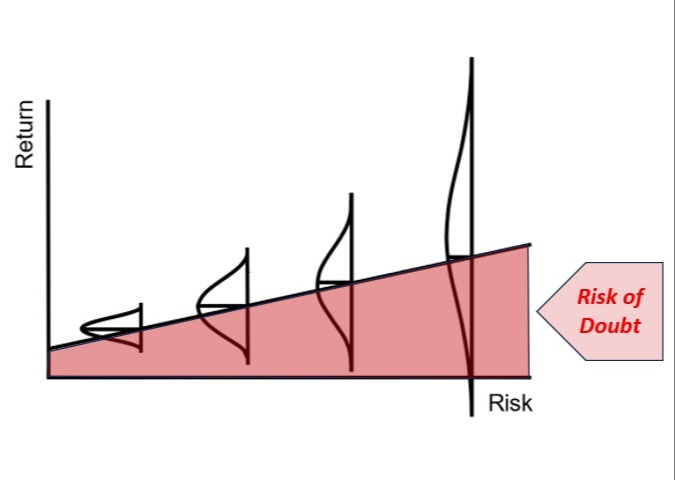
Imagine a portfolio positioned at the far right of the illustration (highest expected risk, highest expected return), allocated entirely to U.S. stocks. To capture future U.S. stock returns effectively, an investor could use a low-cost total U.S. stock market index fund or ETF, which should deliver the benchmark’s returns, less fund expenses. However, as the portfolio’s fund choices deviate from “total U.S. stocks” through factor tilts, active management, or security selection, the range of potential outcomes broadens, and so does the “doubt risk.”
How does this theory work in practice? The top panel of the table below illustrates the returns for four ETFs that track the S&P 500 Total Return Index1 (Figure 2). The expected return for an index fund replicating the benchmark’s holdings is simply the benchmark’s return minus the fund’s expenses, which are typically minimal for index funds. As a result, the Return Participation Ratios for these funds have averaged just shy of 100% over the last 10 years, as shown in the bottom panel. That is, each fund delivered nearly 100% of the S&P 500 Index’s return - exactly as expected.
Figure 2.
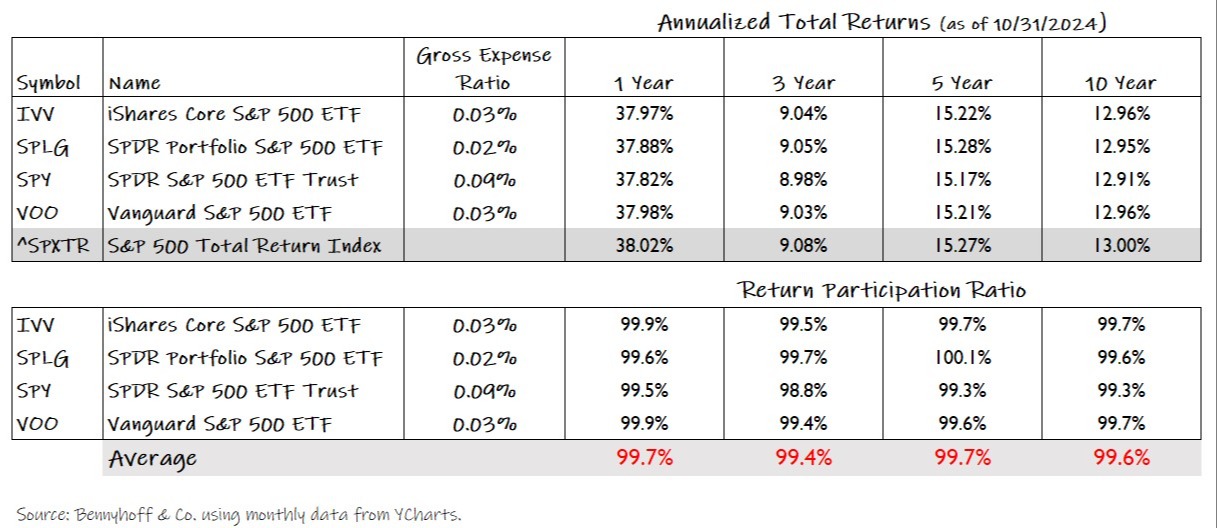
This may sound obvious: index funds and ETFs are performing as designed. That’s the point! While similar to tracking error, the RPR takes a practical- rather than purely statistical - approach to addressing the emotional challenges of investing. There’s value in telling your client: “I can’t predict the returns of the next 10 years (a fact they likely already know), but using an index fund or ETF is the best way to fully participate in those returns.” This clarity helps reduce the chances of clients feeling that their fund manager underperformed, or that you overpromised on expected returns.
The future performance of any well-managed index fund or ETF should closely resemble the table above. However, the further you venture into active strategies and funds, the harder it is to set clear expectations for returns, and the greater the risk that your clients will doubt that their portfolios—or their financial advisors—are the best path to their success. Does this mean you shouldn’t use active funds in your portfolios? Not necessarily, but consider using them selectively for clients who are truly comfortable with uncertain outcomes—not only from the markets, but from their funds as well. Your clients’ long-term success, as well as yours, may just depend on it.
1Please note that S&P 500 Index ETFs were used for illustration because there were a greater number of funds from various issuers that tracked the same benchmark index. U.S. total stock market index funds/ETFs are widely available, and own a much larger number of U.S. publicly-traded companies. However, it is common for these total U.S. stock funds to track similar - yet not identical - benchmark indexes, which affects the nature of the comparison.